ecdf
- xarray_einstats.numba.ecdf(da, dims=None, *, npoints=None, **kwargs)[source]
Compute the x and y values of ecdf plots in a vectorized way.
- Parameters:
- da
xarray.DataArray Input data containing the samples on which we want to compute the ecdf.
- dimshashable or sequence of hashable, optional
Dimensions over which the ecdf should be computed. They are flattened and converted to a
quantiledimension that contains the values to plot; the other dimensions should be used for facetting and aesthetics. The default is computing the ecdf over the flattened input.- npoints
int, optional Number of points on which to evaluate the ecdf. It defaults to the minimum between 200 and the total number of points in each block defined by dims.
- **kwargs
Keyword arguments passed as-is to
xarray.apply_ufuncthroughsearchsorted.
- da
- Returns:
xarray.DataArrayDataArray with the computed values. It reduces the dimensions provided as dims and adds the dimensions
quantileandecdf_axis.
Warning
New and experimental feature, its API might change.
Notes
There are two main reasons for returning a DataArray even if operations do not happen in any vectorized way on the
ecdf_axisdimension. One is that this is more coherent with xarray in aiming to be idempotent. The input is a single DataArray, so the output should be too. The second is that this allows using it with Dataset.map.Examples
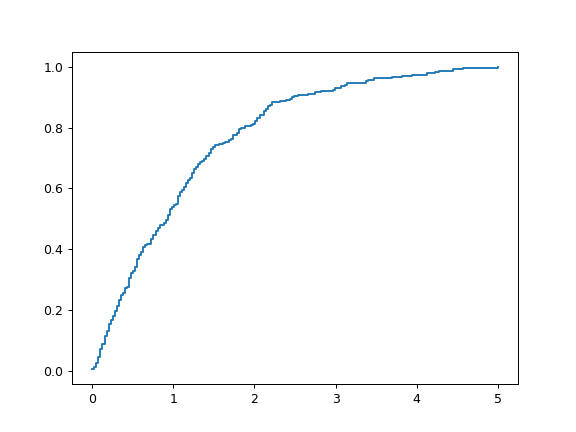
Compute and plot the ecdf over all the data:
from xarray_einstats import tutorial, numba
import matplotlib.pyplot as plt

ds = tutorial.generate_mcmc_like_dataset(3)
out = numba.ecdf(ds["mu"], dims=("chain", "draw", "team"))
plt.plot(out.sel(ecdf_axis="x"), out.sel(ecdf_axis="y"), drawstyle="steps-post");
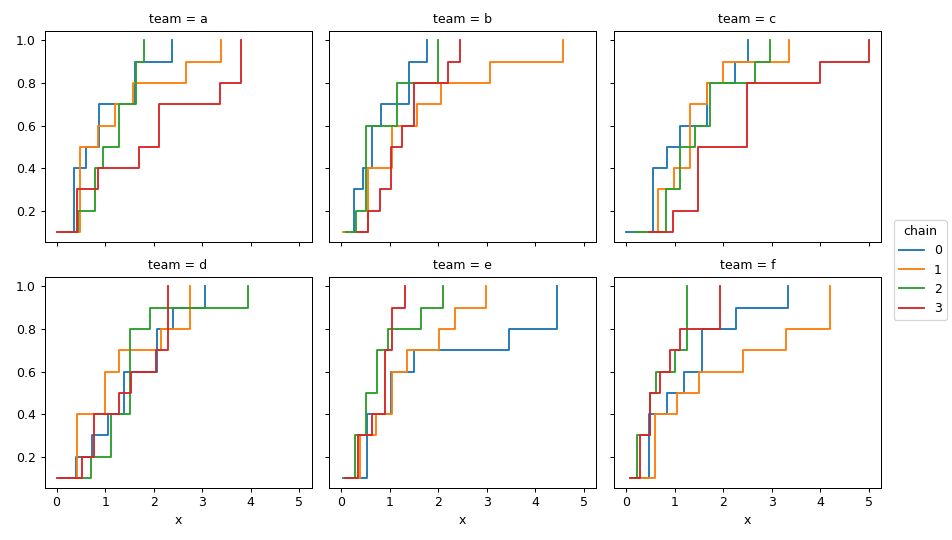
Compute vectorized ecdf values to plot multiple subplots and multiple lines in each with different hue:
out = numba.ecdf(ds["mu"], dims="draw")
out.sel(ecdf_axis="y").assign_coords(x=out.sel(ecdf_axis="x")).plot.line(
    x="x", hue="chain", col="team", col_wrap=3, drawstyle="steps-post"
);